How to Measure Team Productivity Without Micromanaging
If you want to truly understand how your team is performing, you have to stop counting the things that don't matter. The old way of measuring productivity—tallying up hours at a desk or tasks checked off a list—is officially broken. It just creates a culture of performative work,
where everyone is focused on looking busy instead of actually being effective.
This approach doesn't just give you a skewed picture of your team's contributions; it actively torpedoes morale and can even push your best people out the door.
Stop Guessing How Your Team Is Performing

Here's the hard truth: busyness is not a business outcome. In today’s world of hybrid and remote work, what really counts is the impact your team delivers. That means shifting your entire mindset from micromanaging inputs to celebrating real, tangible achievements. This isn't just a nice-to-have; it's a must-do for building a team that lasts.
It's Time for a New Playbook
Pivoting your approach isn't just about making people feel good—it has a direct, measurable effect on performance. When people see a clear line connecting their daily work to the company's biggest goals, their engagement and motivation skyrocket.
So, let's dismantle the myth that activity equals progress once and for all. What you need is a framework that gets to the heart of what your team actually accomplishes.
A smart, modern framework strikes a balance between three core areas:
* Outcomes: The real business results your team delivers. Think revenue, customer satisfaction, or market share.
* Output: The volume of work completed that directly fuels those outcomes. This could be features shipped, articles published, or support tickets closed.
* Efficiency: The resources—time, money, effort—it took to get the job done.
This shift in perspective is crucial. It’s about moving away from vanity metrics and focusing on what truly drives the business forward.
To see what this looks like in practice, here’s a quick comparison showing the evolution from outdated inputs to modern, impactful outcomes.
The Shift From Outdated To Outcome-Focused Metrics
| Traditional Metric (What to Avoid) | Modern Metric (What to Embrace) |
|---|---|
| Hours Logged | Customer Lifetime Value (CLV) |
| Emails Sent | Sales Conversion Rate |
| Lines of Code Written | Feature Adoption Rate |
| Tasks Completed | Net Promoter Score (NPS) |
| Meetings Attended | Time to Resolution (for support) |
Moving to modern, outcome-focused metrics isn't just an update; it's a fundamental change in how you define success. It aligns everyone around what truly matters.
Bridging the Perception Gap
Choosing the right metrics is where so many leaders get it wrong, and it often creates a major disconnect. For instance, while 67% of managers think performance is the best way to measure productivity, only 50% of employees feel the same way. That's a huge gap.
This discrepancy highlights how the metrics you track can directly impact motivation and how fair people feel the system is. Interestingly, both managers and employees agree that efficiency is the second-most important factor, which gives us some common ground to start from. You can dig deeper into these kinds of employee productivity statistics to see just how wide this perception gap can be.
Ultimately, the goal is to get an honest, unfiltered view of your team's effectiveness by tapping into the data from the tools you're already using. Imagine a world where you never have to hunt for information across a dozen different platforms again. Instead, your team gets instant answers right inside their workflow—say, in Slack—freeing them up to do more of the high-impact work that matters. This guide will show you exactly how to build that system.
First Things First: What Does “Productive” Actually Mean Here?
Before you even think about metrics or dashboards, you have to answer a deceptively simple question: what does productivity look like for this team, in this company?
Trying to use the same yardstick for your sales team and your engineering team is a recipe for disaster. You’ll end up with garbage data and, worse, you’ll alienate the very people you’re trying to help. Productivity isn't universal; it's deeply contextual.
The real starting point is to connect the dots between the company's big, ambitious mission and the actual work your teams do every single day. If you skip this step, you’ll find yourself measuring busywork, not business impact.
Turning Lofty Missions into Ground-Level Goals
Let's be honest, a corporate objective like increase market share
doesn't exactly get your marketing team fired up on a Tuesday morning. It's too abstract, too far removed from their daily tasks. It feels like someone else's goal.
Your job is to translate that boardroom vision into something tangible that your team can own. When you do this right, every person sees exactly how their work pushes the entire company forward.
Here’s what that looks like in the real world:
- Company Objective: Grow market share by 15% this fiscal year.
- Marketing Team Goal: Launch three targeted regional campaigns each quarter to crack into new customer segments.
- Sales Team Goal: Drive a 20% lift in qualified demos within those new regions.
- Engineering Team Goal: Ship two new product features that our target market is clamoring for, giving sales the firepower they need.
See the difference? A vague corporate goal just became a clear, interlocking roadmap. Everyone knows their role, and they can see how their success hinges on the success of the teams around them.
Get Everyone in a Room and Define Success Together
The best way to get this alignment—and instant buy-in—is to define what success means with your team, not for them. A collaborative workshop isn't just another meeting; it's how you build a shared reality around what productive
truly means for your group.
This isn't about top-down directives. It's about creating a forum where your team helps write their own definition of winning. That sense of ownership is incredibly powerful and pays dividends from day one.
In this session, you bring the high-level context—the big company objectives. Your role is to facilitate as the team works backward from there to define their specific, measurable contributions. You're there to guide, not dictate.
Questions to Kickstart the Conversation:
1. When we look at the company's top priorities for the year, where can we, as a team, make the biggest dent?
2. What specific outcomes can we deliver that will directly move the needle on those big goals?
3. Fast forward three months. If we were absolutely knocking it out of the park, what would we have actually accomplished?
4. What are the biggest hurdles that could stop us? Let's talk about them now so we can plan around them.
When you walk out of that workshop, you'll have more than just a list of goals. You'll have a team that feels heard and is genuinely invested in the outcome. They won't just know what to do; they’ll understand why their work matters. And that clarity is the bedrock of any meaningful productivity measurement.
Choose Your Metrics Wisely: Output vs. Outcome vs. Efficiency
Once you've got everyone aligned on what productive
actually means for your team, it's time to decide how you're going to track it. This is where a lot of managers go wrong. They often grab onto whatever's easiest to count, but that's a classic mistake. Fixating on the wrong numbers can actually push your team to focus on busywork instead of things that move the needle.
To get a real, honest look at team productivity, you need a balanced diet of metrics. Just tracking one type of metric is like trying to understand a movie by only looking at a single frame—you miss the whole story. The trick is to blend three different kinds of measures: output, outcome, and efficiency.
Think of it as a pyramid. At the top, you have the big company objectives. Those break down into team-level goals, which are then supported by the impact of each individual. Your measurement strategy should mirror this structure.
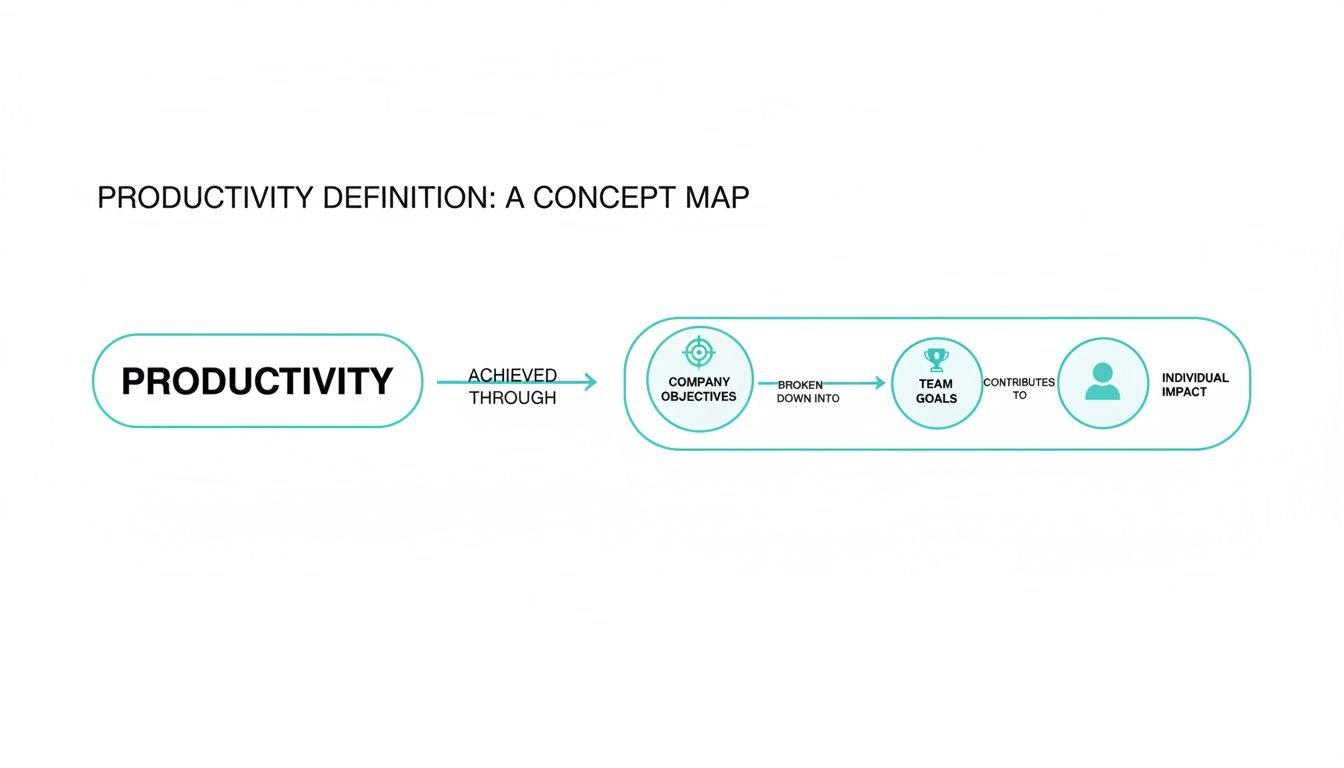
This hierarchy makes sure every single task someone works on is connected to a team goal, which in turn helps hit a core business objective.
Distinguishing Output From Outcome
This is, without a doubt, the most critical distinction to get right. Mixing these two up is like praising a farmer for how many seeds they planted instead of how much food they actually harvested.
Output metrics are all about the volume of work. They're the tangible stuff
your team produces.
* Number of articles published
* Lines of code written
* Sales calls made
* Support tickets closed
These numbers are useful for seeing activity levels, but that's it. On their own, they tell you nothing about value. A team can have a massive output and still have zero meaningful impact on the business.
Outcome metrics, on the other hand, measure the results of all that work. They answer the all-important question: So what?
* Lead conversion rate from those articles
* New feature adoption rate
* Revenue generated from those sales calls
* Customer Satisfaction (CSAT) score
An outcome-focused approach completely changes the conversation. It shifts from
How much did you do?toWhat did we achieve?This directly links your team's daily grind to the company's health and growth.
Adding the Efficiency Layer
The final piece of this puzzle is efficiency. This metric is about the resources—time, money, effort—it took to get to a specific output or outcome. Efficiency gives you crucial context.
For instance, closing 100 support tickets (output) sounds great. But closing them in one day is wildly more impressive than taking a whole week. Similarly, acquiring a new customer for $50 (efficiency) is a huge win compared to spending $500 for the same result.
Efficiency metrics help you see if your team is not just being effective, but also working in a smart, sustainable, and scalable way.
Putting It All Together for Different Teams
The right blend of metrics is never one-size-fits-all; it has to be tailored to what each team actually does.
Let’s look at a software development team. Sure, you can measure their output by counting the number of features they ship. But a far more powerful outcome metric would be the user adoption rate of those features. To add an efficiency layer, you could track cycle time—how long it takes an idea to go from the whiteboard to being live in the product.
Or what about a customer support team?
* Output: Number of tickets resolved per agent.
* Outcome: Net Promoter Score (NPS) or Customer Satisfaction (CSAT).
* Efficiency: Average handle time or cost per resolution.
The table below gives you a few more ideas for how this works across different departments.
Choosing The Right Metric Type for Your Team
This table provides examples of output, outcome, and efficiency metrics across different business functions to help you select the most relevant ones.
| Team Function | Example Output Metric | Example Outcome Metric | Example Efficiency Metric |
|---|---|---|---|
| Marketing | Number of blog posts published | Marketing Qualified Leads (MQLs) generated | Cost Per Lead (CPL) |
| Sales | Number of cold calls made | Total revenue closed | Sales cycle length |
| Engineering | Number of features deployed | User adoption rate of new features | Code review turnaround time |
| Customer Support | Number of tickets closed | Customer Satisfaction (CSAT) score | First response time |
| Human Resources | Number of interviews conducted | Employee retention rate | Time-to-fill for open positions |
When you weave all three types of metrics together, you get the complete narrative. You see how much work is getting done, whether it's actually making a difference, and how sustainably it’s all happening. This holistic view is the secret to measuring productivity in a way that truly motivates your team and drives real business value. It helps everyone avoid the trap of just rewarding activity over actual achievement.
Look for Productivity Clues Where Your Team Already Works
So, we've talked about the what
—the metrics that matter. Now for the where.
Where do you find all this rich data without drowning your team in more tracking tools and spreadsheets?
The answer is probably staring you right in the face. The most honest, unfiltered data about your team’s productivity isn't in some formal report. It's woven into the very fabric of their daily collaboration.
For most of us these days, that means Slack. It's the digital town square where problems get solved, questions get asked, and knowledge gets passed around. By tapping into these conversations, you get a real-time view of the friction points slowing everyone down. This isn't about playing Big Brother; it's about seeing—and fixing—the invisible hurdles that kill momentum.
The True Cost of Just a Quick Question
Think about your go-to expert, that senior engineer or product manager everyone relies on. Now, imagine them getting hit with the same question over and over again from different people throughout the week. Each one of those pings is more than just a momentary distraction. It’s a full-blown context switch that shatters their focus and grinds high-value work to a halt.
It's not just a gut feeling; the data backs this up. Research shows it can take over 23 minutes to get back into a state of deep work after a single interruption. Multiply that across your entire team, day after day, and you're looking at a colossal, hidden productivity tax.
These repetitive questions are a massive red flag. They signal a critical knowledge gap, forcing your team into a painful loop of searching for information, waiting for a response, and interrupting someone else. But within that frustration lies a goldmine of opportunity.
Turn Annoying Questions into Powerful Assets
What if you could break that cycle for good? Imagine a workday where your team never has to open another resource, search multiple platforms for information, or interrupt a colleague ever again. What if they could just ask a question in Slack and get an instant, accurate answer?
This is where you transform productivity. By paying attention to the most common questions in channels like #dev-help or #sales-questions, you pinpoint the exact information bottlenecks that are silently draining your team's energy and focus. Every recurring question is a flashing neon sign pointing to a process that can be radically improved.
Imagine your entire team having a single source of truth that lives where they already work. No more digging through stale Google Drives or outdated Confluence pages. Just asking SAI in Slack and getting the exact answer you and your team are looking for, right now.
This shift isn't just a minor tweak; it directly impacts your bottom line. When your team gets instant answers without having to tap a colleague on the shoulder, you aren't just saving them a few minutes. You're giving them back hours of focused time to pour into the work that actually moves the needle.
A Smarter Way to Measure Efficiency
This approach gives you a whole new, and frankly more interesting, set of efficiency metrics to track. Instead of just looking at how fast a task was completed, you can start measuring the speed and quality of information flow itself.
Think about tracking these new indicators of a healthy, efficient team:
* Fewer Repetitive Questions: Is the volume of common questions in key channels going down over time? A steady decline is a great sign that your knowledge base is actually working.
* Time Saved by Self-Service: Put a number on the hours your team gets back by using an AI assistant instead of waiting for a person to reply.
* More Time for Deep Work: When your subject matter experts are freed from answering the same questions, you should see their output on major projects and strategic goals go up.
Focusing on how your team shares knowledge internally is a huge part of modern operational excellence. By automating the flow of information, you're not just answering questions faster—you're building a more resilient and empowered team. If you want to go deeper, our guide on how workflow automation can transform your work is a great next step.
Ultimately, finding the insights hidden in your workflow is about creating an environment where deep, focused work is the default, not a luxury. It’s about giving your team the one resource they can never get back: their time.
Build a Dashboard That Tells a Story

Raw data is just noise. A story is what inspires action. Once you've gathered your productivity data, the real work begins: weaving it into a clear, compelling narrative that your team can actually get behind. This isn't about creating complicated charts to impress the C-suite; it's about building a simple, motivating dashboard that serves as a transparent source of truth for everyone.
The goal here is to sidestep the classic death by data
trap, where you’re tracking a dozen metrics that nobody understands or cares about. A powerful dashboard is ruthlessly focused. It highlights just a handful of key metrics—the ones you’ve already carefully selected—that tie daily work directly to your most critical business outcomes.
Craft a Narrative, Not Just a Report
Think of your dashboard as a visual storyteller. Every single chart, every number, should contribute to the broader story of your team’s journey. Are you building momentum? Are you on track to smash your quarterly goals? Is there a potential bottleneck lurking around the corner? The right visuals make the answers to these questions obvious at a single glance.
This means choosing visualizations that put progress front and center and celebrate the wins along the way. A simple burn-down chart can be incredibly effective at showing how the team is chipping away at a huge project, while a rising trendline for customer satisfaction scores can be a massive morale booster. Always choose clarity over complexity.
Combine Data Sources for a 360-Degree View
Your best insights rarely come from a single place. A truly effective dashboard doesn't just pull data from Jira or Asana. It blends that information with signals from your team's daily workflow to paint a much richer, more complete picture.
Imagine pulling these different streams together:
- Project Management Data: See how key initiatives are progressing against timelines.
- Customer Feedback: Directly track how the team's work is moving the needle on user satisfaction.
- Workflow Insights: Pinpoint where information flows smoothly and where knowledge gaps are creating friction.
When you bring these elements together, you can draw a straight line from effort to impact. For example, you might see that right after shipping a new feature (an output), your customer satisfaction scores (an outcome) jumped 5%. That’s a story worth telling—and celebrating.
A great dashboard is the team's scoreboard, but it’s not there to scrutinize individuals. It’s a tool for collective empowerment, helping everyone see where they stand and what they need to do to win together.
The Power of a Single Source of Truth
When your team has one trusted place to see how they're performing, something incredible happens. The endless status update meetings start to fade away. People stop digging through old emails, spreadsheets, and a half-dozen different apps just to figure out what’s going on.
This centralized view creates a powerful sense of shared ownership and accountability. With everyone looking at the same data, conversations become more focused and productive. Instead of debating whose numbers are correct, the team can dive straight into what the numbers are telling them and decide on a course of action together.
A well-designed dashboard turns measurement from a top-down chore into a bottom-up tool for self-management and continuous improvement. It builds the foundation for a transparent culture where data is used to support and empower, not to micromanage. By automating this data flow, you also free up valuable time—much like how a modern knowledge management system automates access to information.
Turn Your Productivity Insights Into Meaningful Action
Building a slick dashboard full of data is just the first step. The real magic happens when you translate those numbers into changes that actually help your team. After all, what’s the point of measuring anything if it doesn’t spark improvement?
This final phase is where the story your data tells becomes a roadmap for growth. It’s not about pointing fingers or calling out underperformers. It’s about using objective insights to have supportive, constructive conversations. Think of your dashboard as a coaching tool, not a critique sheet, that shows you exactly where your team needs better support, clearer processes, or the right tools to win.
From Data Points to Development Plans
When you sit down to review your productivity dashboard, put on your detective hat. Instead of jumping to conclusions about any one person, hunt for the larger patterns. You’re looking for the systemic friction—the hidden roadblocks holding everyone back.
Let's say you see that your customer support agents are spending a huge chunk of their day answering the same five questions. That's not a performance issue; it's a system screaming for an upgrade. This insight is your signal to build a better solution, like a smart knowledge base that deflects those repetitive queries before they ever hit an agent's inbox.
Suddenly, your team is freed up to tackle the complex, high-value customer problems that genuinely need a human touch.
The real goal here is to build a culture of continuous improvement. You want data to be a tool that supports and empowers your people, ultimately leading to stronger, more sustainable productivity and way higher job satisfaction.
Automate the Answers Draining Your Team
Picture this: no more digging through ancient Google Docs or tapping a coworker on the shoulder for an answer you know they've given a dozen times. Once you've identified those recurring questions that grind your team’s momentum to a halt, you can plug that knowledge gap for good.
This is where a tool like SAI can be a game-changer, delivering instant, automated answers right inside Slack.
You're not just saving a few minutes here and there; you're fixing a fundamental productivity drain. The shift is immediate:
- No more waiting around. Team members get what they need, the moment they need it, without breaking their focus.
- Fewer interruptions. Your go-to experts can finally get back to deep work instead of acting as human search engines.
- A smarter team, collectively. Every question asked and answered makes the entire knowledge base stronger, lifting everyone up.
By automating these knowledge gaps, you're making a system-level change that fundamentally improves how your team works together. This is just one of many transformative ways to improve employee productivity that creates a more focused, resilient, and resourceful team.
Common Questions About Measuring Team Productivity
How do I measure my team's productivity without making them feel like they're being watched?
This is probably the most common (and important) question managers ask. It's a delicate balance. Nobody wants to feel like Big Brother is looking over their shoulder, and trust is the bedrock of any great team.
The secret is to change the entire conversation. Frame measurement as a way to support the team, not to police them. When you shift the focus from tracking individual mouse clicks to understanding shared team outcomes, everything changes. The question goes from, What did you do all day?
to What's getting in our way, and how can I help clear the path?
This approach shows you're on their side.
How can I make sure the metrics are actually fair?
Fairness is all about collaboration and transparency. You can't just hand down metrics from on high and expect people to embrace them.
The single most effective thing you can do is build the metrics with your team. Sit down with them and define what success looks like together. When people have a hand in creating the yardstick, they're naturally going to see it as fair and buy into the process.
Also, a crucial rule of thumb: always prioritize team-level outcomes over individual outputs. This isn't about pitting people against each other. It’s about reinforcing that you're all pulling in the same direction, celebrating collective wins, and solving problems as a single unit.
What if my team pushes back on being measured?
Let's be honest, pushback is normal. It usually comes from a bad past experience—maybe a micromanaging boss or a clunky, invasive tracking system. The antidote is radical transparency about why you're doing this.
Explain that your goal isn't to watch their every move. It's to spot the frustrating, systemic roadblocks that slow everyone down. It's about finding real reasons to celebrate wins and discovering smarter ways to work.
My best advice: Start small. Don't roll out a massive, complex dashboard overnight. Pick just one or two outcome-focused metrics the whole team agrees on. Then, most importantly, show them how you're using that data to make their work easier. Once they see that the numbers lead to positive changes—like getting a clunky process fixed or justifying a new tool—that resistance almost always melts away.
Stop the endless search for information. With SAI, your team gets instant, accurate answers right inside Slack, freeing them up for the deep, focused work that drives real results. Transform your team's productivity by turning repetitive questions into an automated knowledge base. Start for free at sai-bot.ai.